Novo Nordisk (NOVO B) is one of Europe’s most respected pharmaceutical companies and a long‑time dividend payer. After a sharp price decline over the past two years, many investors now see it as a potential bargain.
But is it a hidden gem at plain sight or just another value trap?
In this Novo Nordisk stock analysis, we’ll break down the business using my simple, fundamentals‑driven stock analysis approach, and find out why its low price might not be as cheap as it looks.
Let’s dive in.
Full disclosure: I don’t own Novo Nordisk stocks at the time of writing this analysis.
⚡Key Takeaways
- Novo Nordisk is a leading European pharma company focused on diabetes and obesity drugs.
- Revenue and earnings grew strongly from 2018–2025, but growth has been inconsistent.
- Free cash flow is positive but not growing, and debt levels have risen sharply.
- My simple stock analysis method suggests the stock trades between fair value and a potential 35% discount.
- Final take on Novo Nordisk: too hard! Despite its low price, the business is difficult to assess with high conviction.
What Does Novo Nordisk Do?
Novo Nordisk is a Denmark-based global healthcare company better known for its diabetes and obesity drugs.
The company engages in the discovery, development, manufacturing and marketing of pharmaceutical products. It operates through two business segments: diabetes and obesity care, and biopharmaceuticals.
The diabetes and obesity care segment covers insulin, GLP-1, other protein-related products, such as glucagon, protein-related delivery systems and needles, and oral anti-diabetic drugs.
The biopharmaceuticals segment covers the therapy areas of hemophilia care, growth hormone therapy and hormone replacement therapy.
It sells in over 180 countries, and its regional structure consists of two commercial units: North America and International Operations.
Stock Price Long‑Term Trend
Novo Nordisk’s long-term stock price chart shows a consistent upward trend. Though, there was a sharp jump starting 2021, and a strong correction starting mid-2024— bringing today’s price back near 2021 levels again.
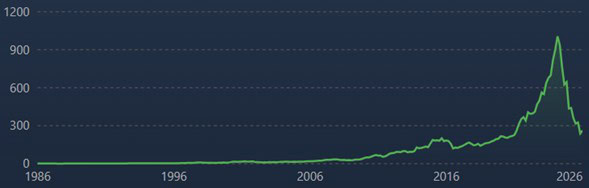
Without additional information, we must wonder what happened between 2021 and 2026.
Did earnings spike unsustainably and revert? Or did market sentiment about Novo Nordisk simply detached from fundamentals?
Since stock prices follow earnings over the long term, this distinction matters.
Novo Nordisk Fundamental Analysis
Let’s have a closer look into the business fundamentals.
1. Past Performance
Revenue
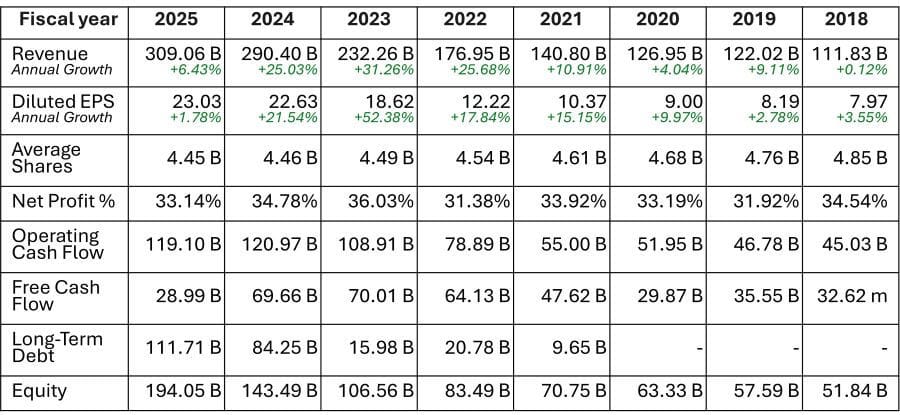
Revenue grew steadily between 2018 (DKK 111.83 B) and 2025 (DKK 309.06 B). The annual growth has been quite volatile, but averaged roughly within the 15–20% range, which is good for a company of this size.
Earnings
Its earnings per share followed a similar pattern, again roughly 15–20% annual growth.
Share Count
The number of shares outstanding in the market was reduced from 4.85 B to 4.45 B between 2018 and 2025. However, buybacks did not meaningfully boost earnings per share, since profit growth and earnings per share growth were nearly identical.
Net Profit Margin
Net profit margin did not deviate much from 33% between 2018 and 2025. This is a healthy margin, and it doesn’t seem to be going anywhere. Novo Nordisk seems to have strong competitive advantages and pricing power.
Cash Flow
Operating cash flow shows a clear upward trend and the company’s operation is generating more and more money every year — that’s great.
On the other hand, free cash flow trend is not so clear, and it didn’t grow between 2018 and 2025. The main reason seems to be the heavy investment spending, especially in 2024 and 2025.
2. Financial Health
The company’s financial position is getting worse.
The debt-to-equity ratio reached 58% in 2025, well above the ideal 30% threshold. And debt has been rising consistently over the latest years.
3. Dividends
Novo Nordisk pays a forward dividend of DKK 11.70 per share, yielding 4.7% — that’s considerably high. Also, the company has paid a consistent and increasing dividend for over two decades.
The question here is whether this is sustainable going forward with increasing debt levels and non-growing free cash flow.
4. Growth Outlook
Past Growth
As we’ve seen above, both revenues and earnings per share increased around 15-20% annually. They always trended up but quite in an inconsistent way.
Future Expectations
Now here’s my educated guesstimate on Novo Nordisk based on past performance.
The company’s growth rate has been pretty inconsistent. And after a period of high growth between 2022 and 2024, it seems to be decelerating back to a more moderate baseline.
To be on the safer side, I will assume a conservative 7-12% annual earnings growth going forward. That puts Novo Nordisk in the “stalwart” category.
Novo Nordisk Fair Value Estimate
Now it’s time for our back-of-the-envelope valuation assessment. The goal is to get an approximation interval through quick and simple calculations.
Owner’s Earnings
Let’s start by estimating the total potential return on investment by using the owner’s earnings. This is nothing more than adding the expected future growth of earnings per share and the forward dividend yield.
Expected return = future EPS growth (7–12%) + dividend yield (4.7%) ≈ 12–17% per year
If the stock is fairly priced, this is the return an investor might expect.
PEG Ratio
So, let’s assess whether the stock is trading at a fair price or not using the PEG ratio.
If we compare the stock current P/E ratio (TTM) of 11x with our owner’s earnings estimate of 12–17% we can see already a potential undervaluation showing up.
PEG = P/E ÷ Owner’s earnings = 0.9 to 0.6
And from Peter Lynch’s growth at a reasonable price approach, we know that a PEG below 1 suggests undervaluation. Therefore, Novo Nordisk seems to be somewhere between near fair price and too cheap for the return it offers.
Fair Value Estimate
If Novo Nordisk was priced in line with its growth (PEG ≈ 1), its P/E should be between 12–17x versus today’s 11x.
This implies the stock may actually be (nearly) fairly price or, in best case scenario, up to 35% undervalued. Is that enough of a margin of safety to confidently invest? Not if you ask me.
Conclusion: Is Novo Nordisk a Good Investment?
Here’s my final take on Novo Nordisk: a top European pharma company but unfortunately, it’s just too hard for me to assess with conviction.
Why? Let’s recap everything.
Does the Company Have Solid Financials?
Not really. The good news is Novo Nordisk has double-digit margins and pays a generous dividend to investors.
The not so good news is revenues and profits growth rates are very unstable and hard to project going forward.
And the bad news is free cash flows are inconsistent and not growing. Plus, the company has high levels of debt which have been worsening in the latest years.
Do I Understand the Business Model?
Not really. It’s hard to assess the competitive advantage durability looking forward. Patent cycles, drug pipelines, and regulatory risks make forecasting uncertain.
It’s hard for me to have high conviction about future estimates on Novo Nordisk. And without confidence in future estimates, valuation becomes shaky.
Does It Trade at a Fair Price?
Yes. Based on this simple stock analysis approach, Novo Nordisk is trading somewhere between near fair price and a 35% price discount.
👉 Action step: Take another look at Novo Nordisk using your own assumptions. Do you agree with this assessment, or do you see something I’ve missed? Share your thoughts in the comments — I’d love to hear your perspective.
And if you haven’t yet, subscribe for more fundamentals‑driven stock analyses.